Monitor Servers (Zabbix)
Important
Zabbix is an external, fully-functional tool that is officially supported by Cybereason, but is currently primarily used by Technical Support. We are in the process of improving accessibility and adding documentation for this tool, to allow for smoother use and a better understanding of the various alerts.
In this topic:
Zabbix overview
The Cybereason Platform monitors Cybereason On-Prem environments using Zabbix, an open-source monitoring tool for diverse IT components, including networks, servers, VMs, and cloud services. Cybereason leverages Zabbix to provide monitoring metrics, including network utilization, CPU load, and disk space consumption. The Cybereason Defense Platform supports Zabbix version 5.0.
Defenders can use Zabbix to:
Monitor the operating system CPU, memory, network, and operating system load on machines on which the servers are running
Check that the hosts are available
Check that the Docker daemon is up on the MDS microservice, the Microservices server, and the Scribe microservice
Check that the following servers and services are up and healthy:
Microservices server
Detection server
Registration server
WebApp server
Configuration management server
Local Threat Intel server and Local Threat Intel database
MDS microservice
Management microservice
Arbiter microservice
Scribe microservice
PostgreSQL microservice
RabbitMQ microservice
Access Zabbix
Make sure that your environment’s firewall allows port 8444.
To access Zabbix, enter the monitoring IP or URL in the browser. For example, https://192.168.10.12:8444.
Log in with the following default credentials:
User: Admin
Password: zabbix
If you need to update the password for the Admin user, Cybereason recommends that you create a new user instead of changing the password for the existing user.
View monitoring information
Main dashboard
The Cybereason Platform displays the state of the monitored components on the Zabbix dashboard. The dashboard includes a general summary of the information and problems in the environment.

The System information area includes information about the environment, such as the total number of servers that have an installed Zabbix agent, the total number of templates, items, or triggers, and more.
The Problems area displays a list of ‘problem events’, which indicate issues or problems in the environment. Problem events specify whether a component is down or is unavailable.
When there are no problem events listed under the Problems section besides the no sensors connected event, this indicates that the environment is functioning properly with no issues. The no sensors connected event visible under the Problem/Severity column indicates that no sensors are connected to the relevant Detection servers. If no sensors are connected to the relevant Detection server, this is an expected event and does not require any action. If sensors are connected to this server, contact Technical Support.
Alerts of type Disaster, High, Average, and Warning typically indicate issues that require your attention. When you encounter problem events, check if the servers that triggered the problem events are up and running, and are not currently undergoing maintenance. For additional assistance, contact Technical Support.
For more information on the dashboard screen, see the Dashboard section in the Zabbix documentation.
Monitoring > Hosts screen
The Monitoring > Hosts screen displays a list of hosts and details about the connectivity from the Configuration management server (named Zabbix server in the Zabbix Web UI) to the other servers. When every server has a green “ZBX” icon under the Availability column, and an Enabled status under the Status column, this indicates that the environment is functioning properly, and there are no connectivity issues between the Zabbix agent and all servers in the environment.
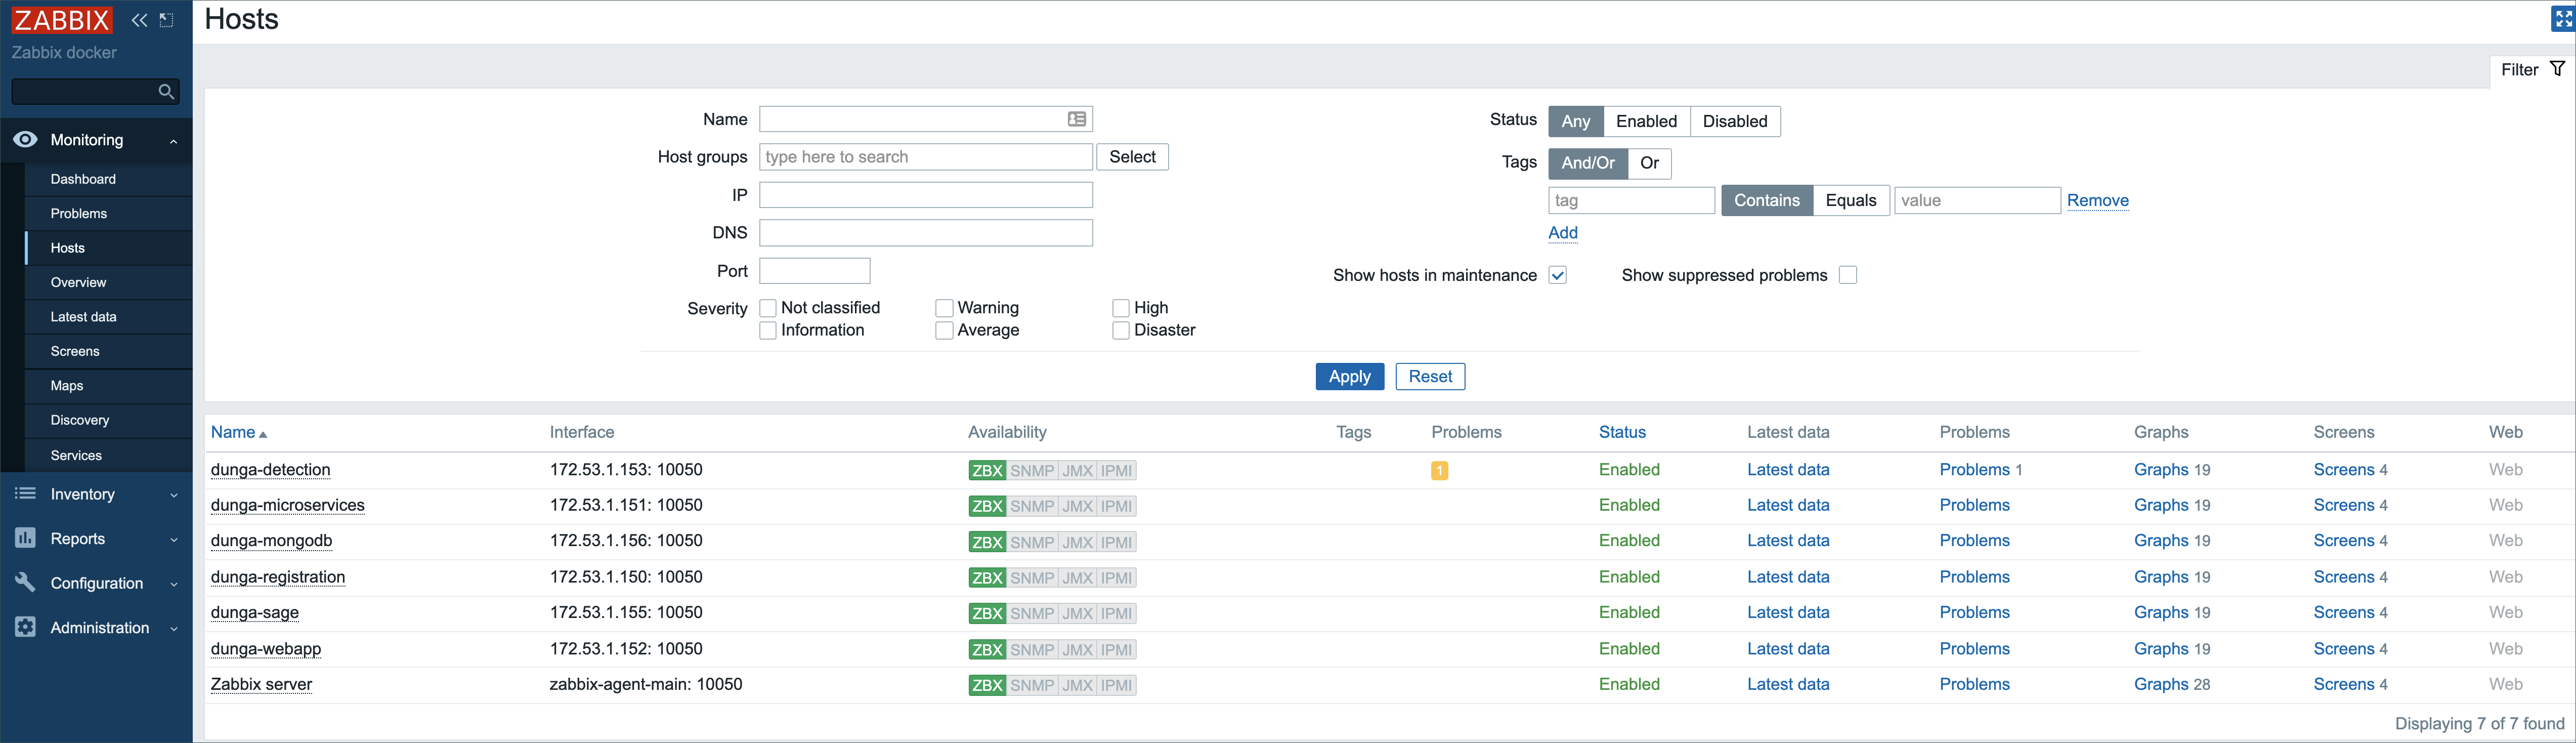
If the ZBX icon in the Availability column is red, this may indicate that the server is not connected properly or is currently being rebooted. For other issues, contact Technical Support to resolve the error.
For more information, see the Monitoring Hosts section in the Zabbix documentation.
Latest Data Screen
The Monitoring > Latest data screen allows you to view different monitored items, information and graphs for specific Zabbix application(s), per relevant server(s) in the environment.
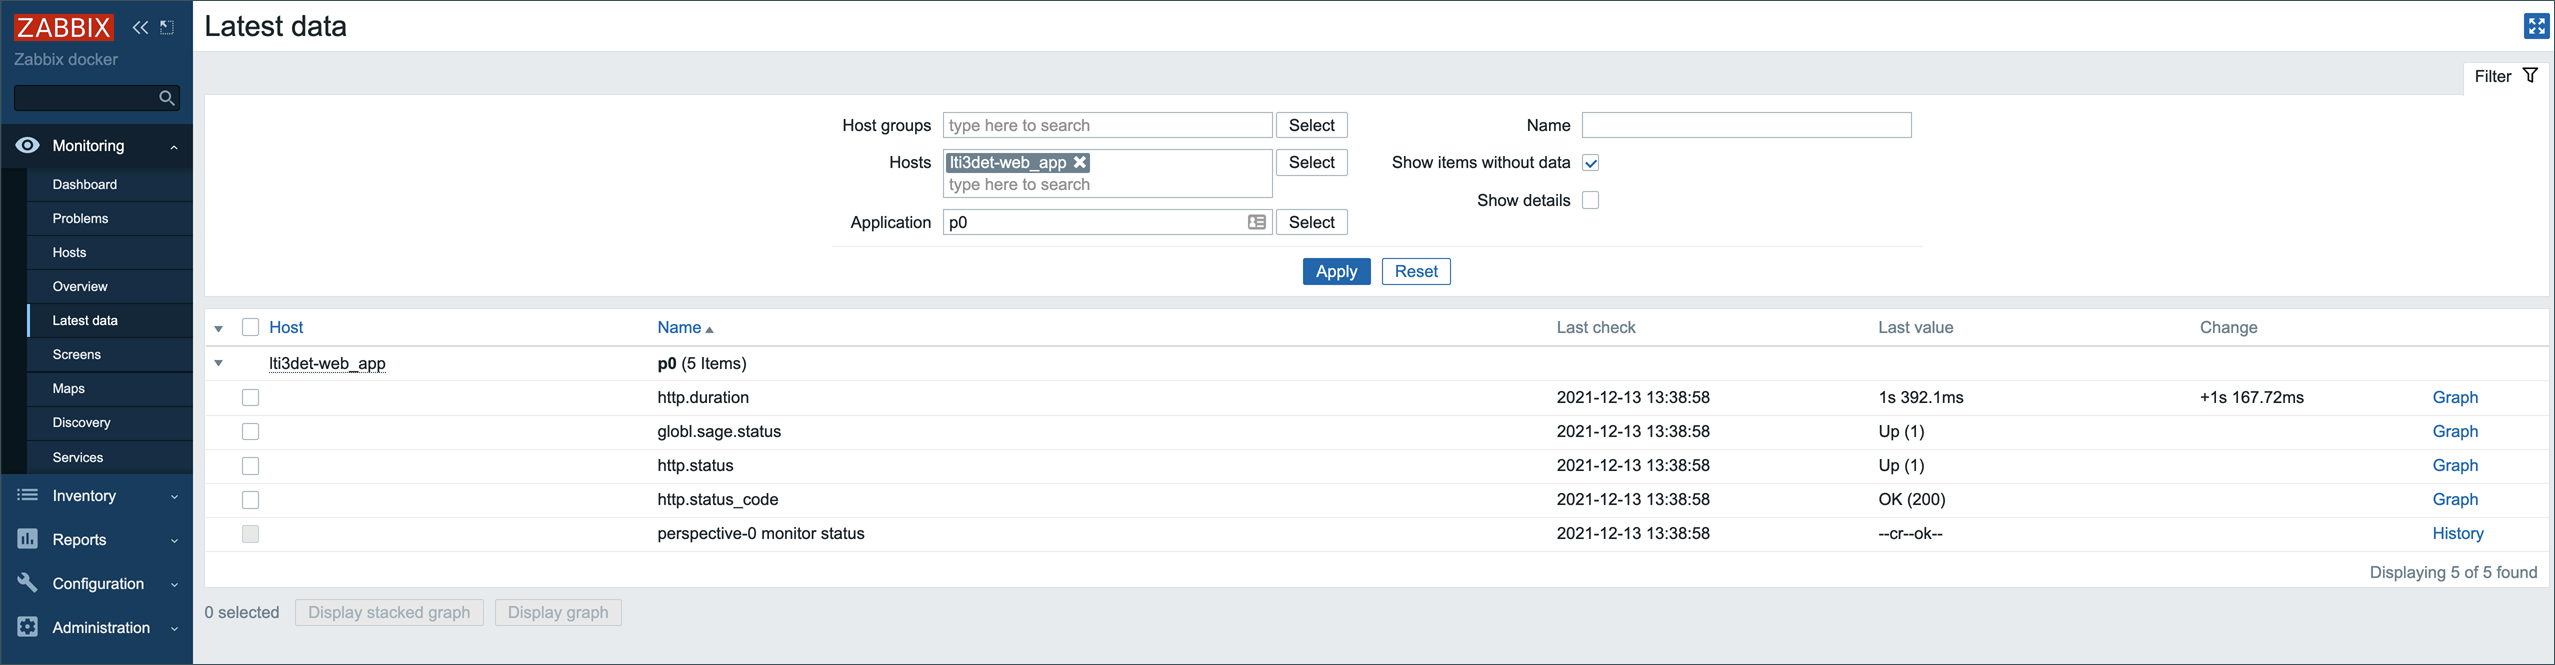
We recommend that you filter the data by the relevant host(s). You can also filter by applications and other components.
For more information, see the Latest data section in the Zabbix documentation.
Configuration > Hosts screen
The Configuration > Hosts screen provides a detailed description for each relevant server, including configurations, templates, applications, triggers, etc.
Important
Cybereason recommends that you do not make any changes to the servers under this screen. Making changes to a server might disable the monitoring for that server.

For more information, see the Configuration Hosts section in the Zabbix documentation.
Manage uses in Zabbix
To add, delete or edit users, see the Login and configuring user section in the Zabbix documentation.